Rocky Mountain Area Natural Gas Daily Price Review – June 2025
Brian Jeffries
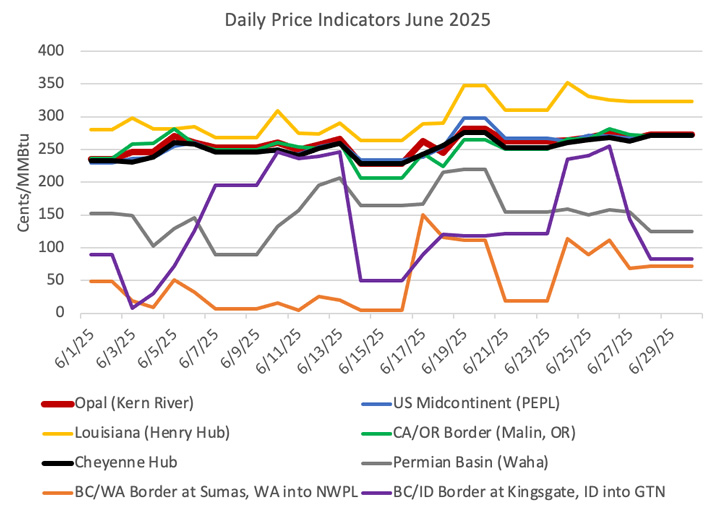
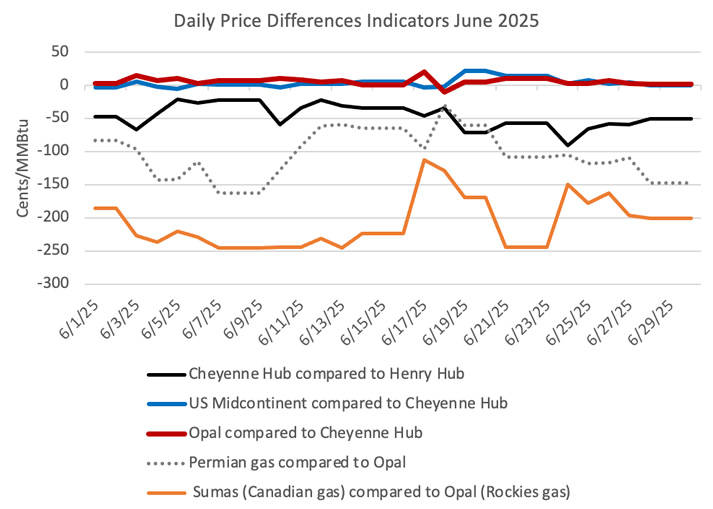
The charts below depict the daily cash price for natural gas at Opal and at the Cheyenne Hub for each day in June 2025. Also shown are prices at some key locations downstream from Wyoming going to the west and going to the midcontinent region and the price for Waha, TX which represents the Permian Basin. The average daily spot price in Southwest Wyoming at Opal and the average daily spot prices in Southeast Wyoming and at the Cheyenne hub were essentially the same. The substantially lower price for Canadian supplies from Alberta (through Kingsgate, ID, the purple line on the first chart) and from British Columbia (through Sumas, WA, the orange line on the first chart) are evident. The low prices for imported gas at Sumas have caused Northwest Pipeline Company to flow southbound all month and in so doing, deliver Canadian gas into the Opal area for further disposition.
The last chart now includes a line for the difference between Opal (Rockies gas) and Sumas (Canadian gas). A negative value in the orange line depicts the extent to which Canadian gas is cheaper than Rockies gas.
There are only two charts this month. Previously there were four. The reason for the previous two extra charts was to remove the consistently low Waha price from each version of the chart because the low Waha price tended to expand the y-axis. However, prices at Sumas are even lower than at Waha, so making version of the charts with no Waha price makes no difference in the range of the y-axis.