Rocky Mountain Area Natural Gas Daily Price Review – May 2026
Brian Jeffries
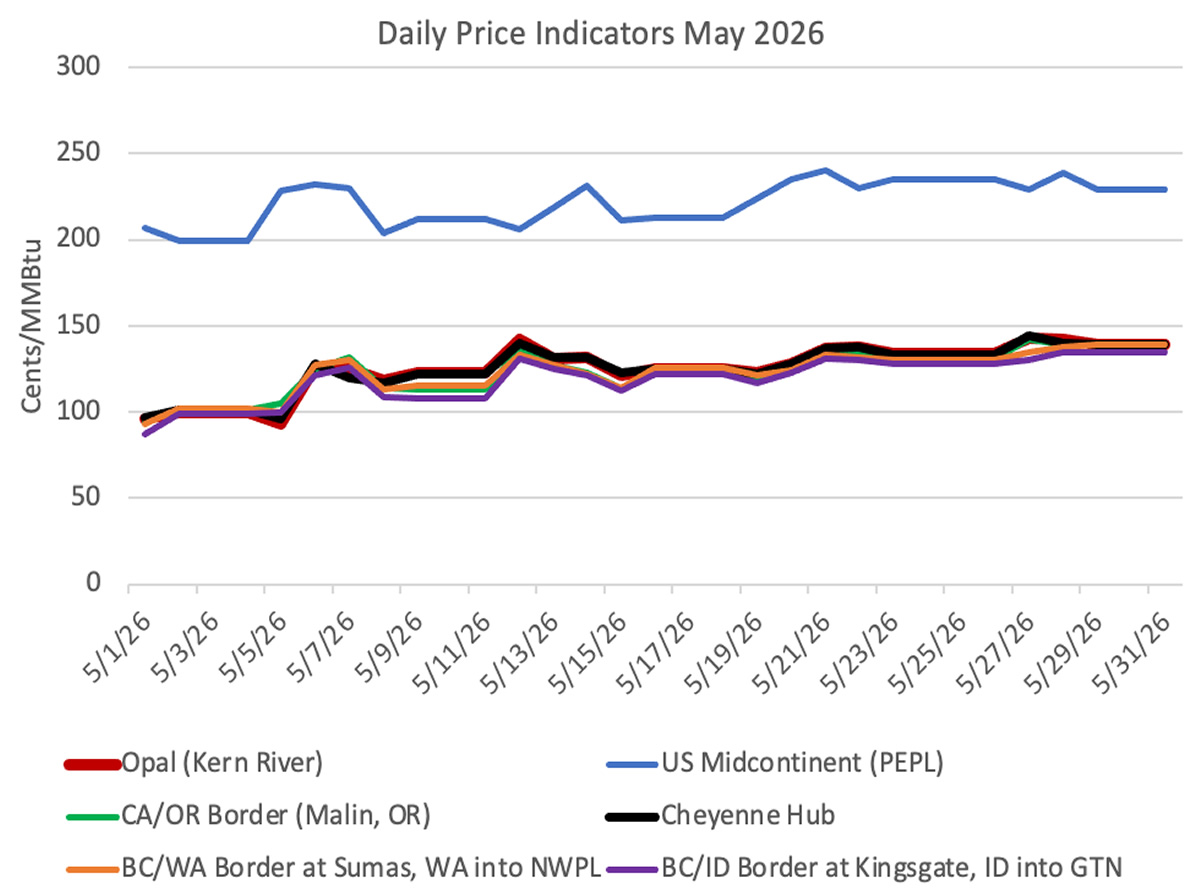
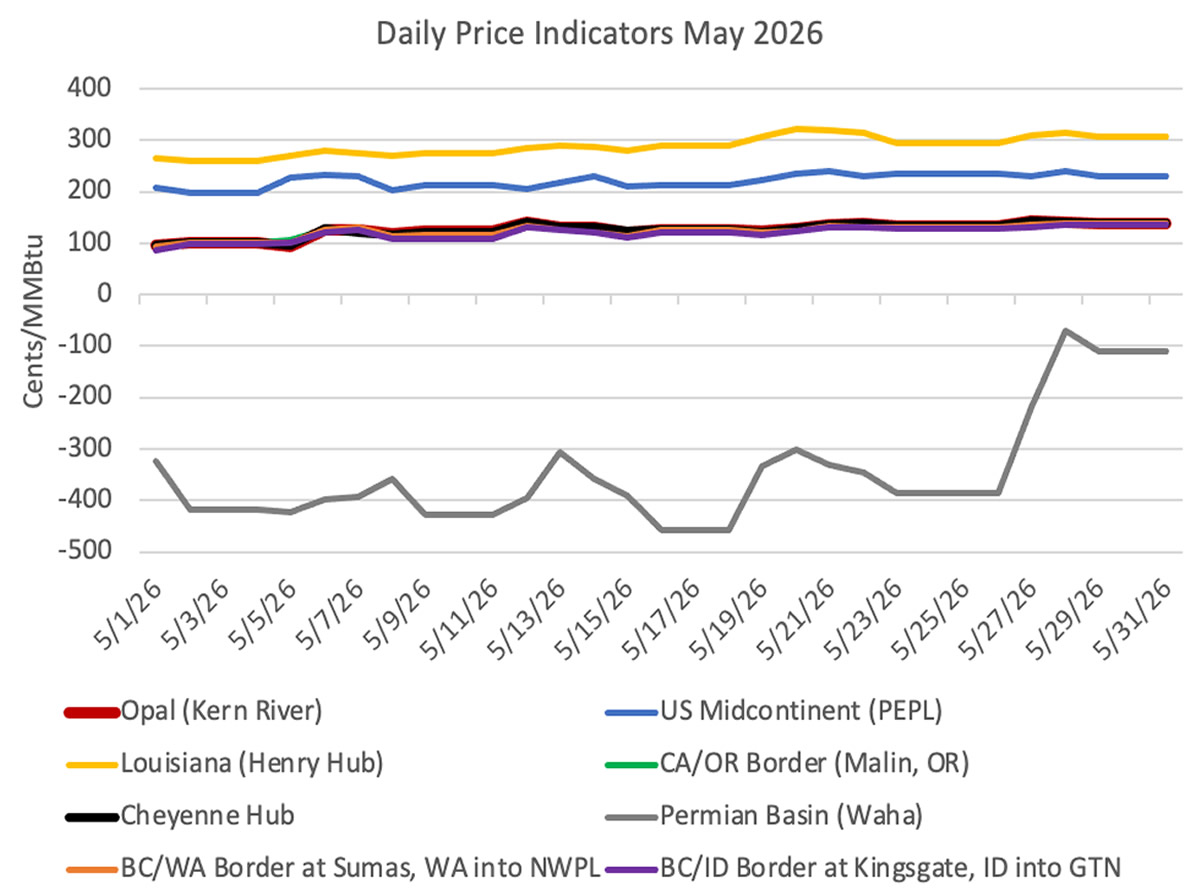
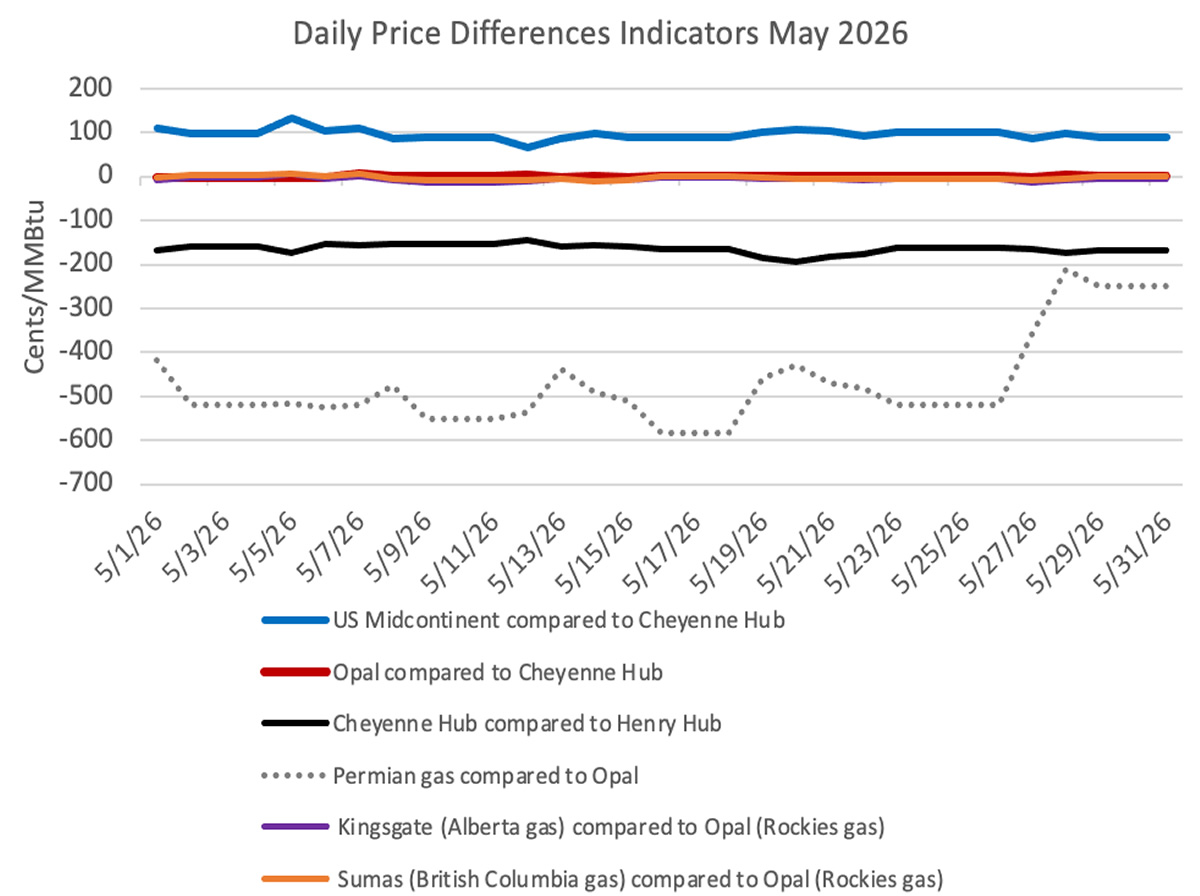
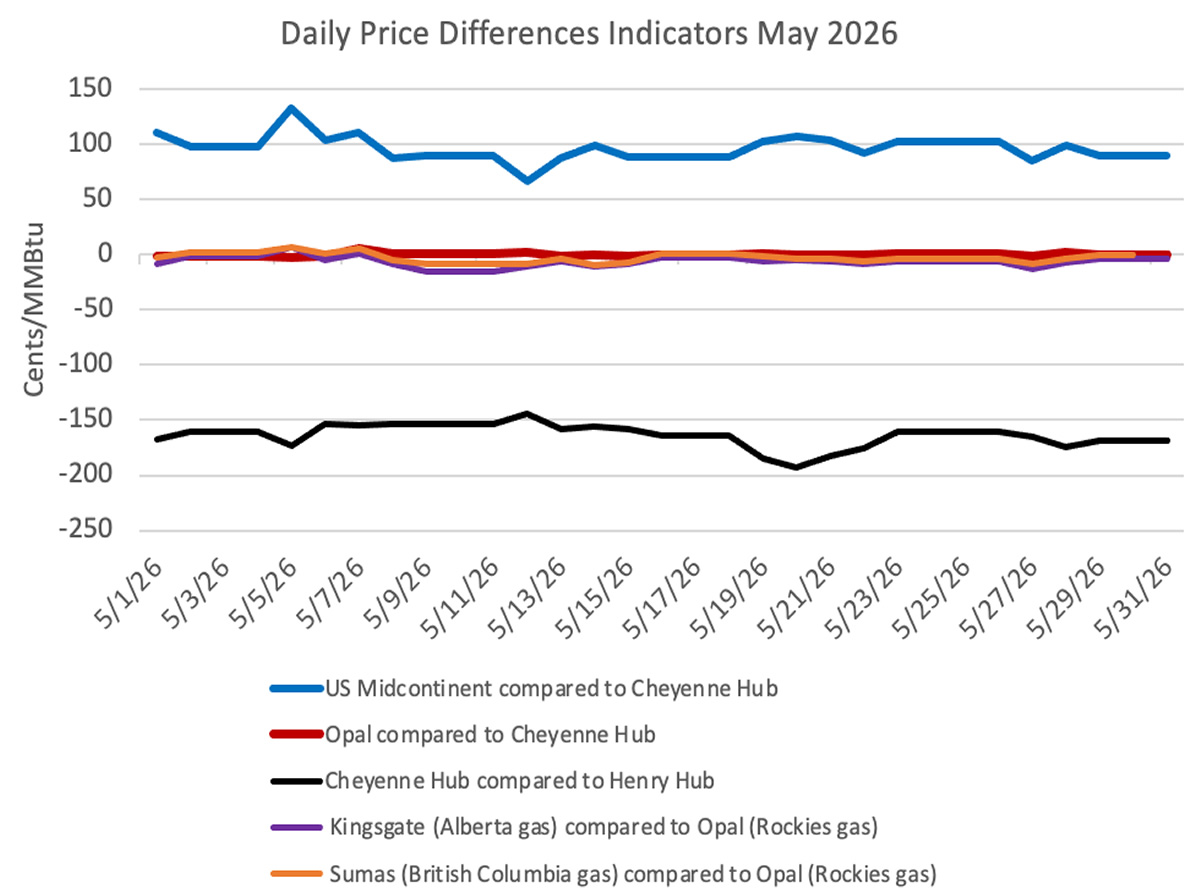
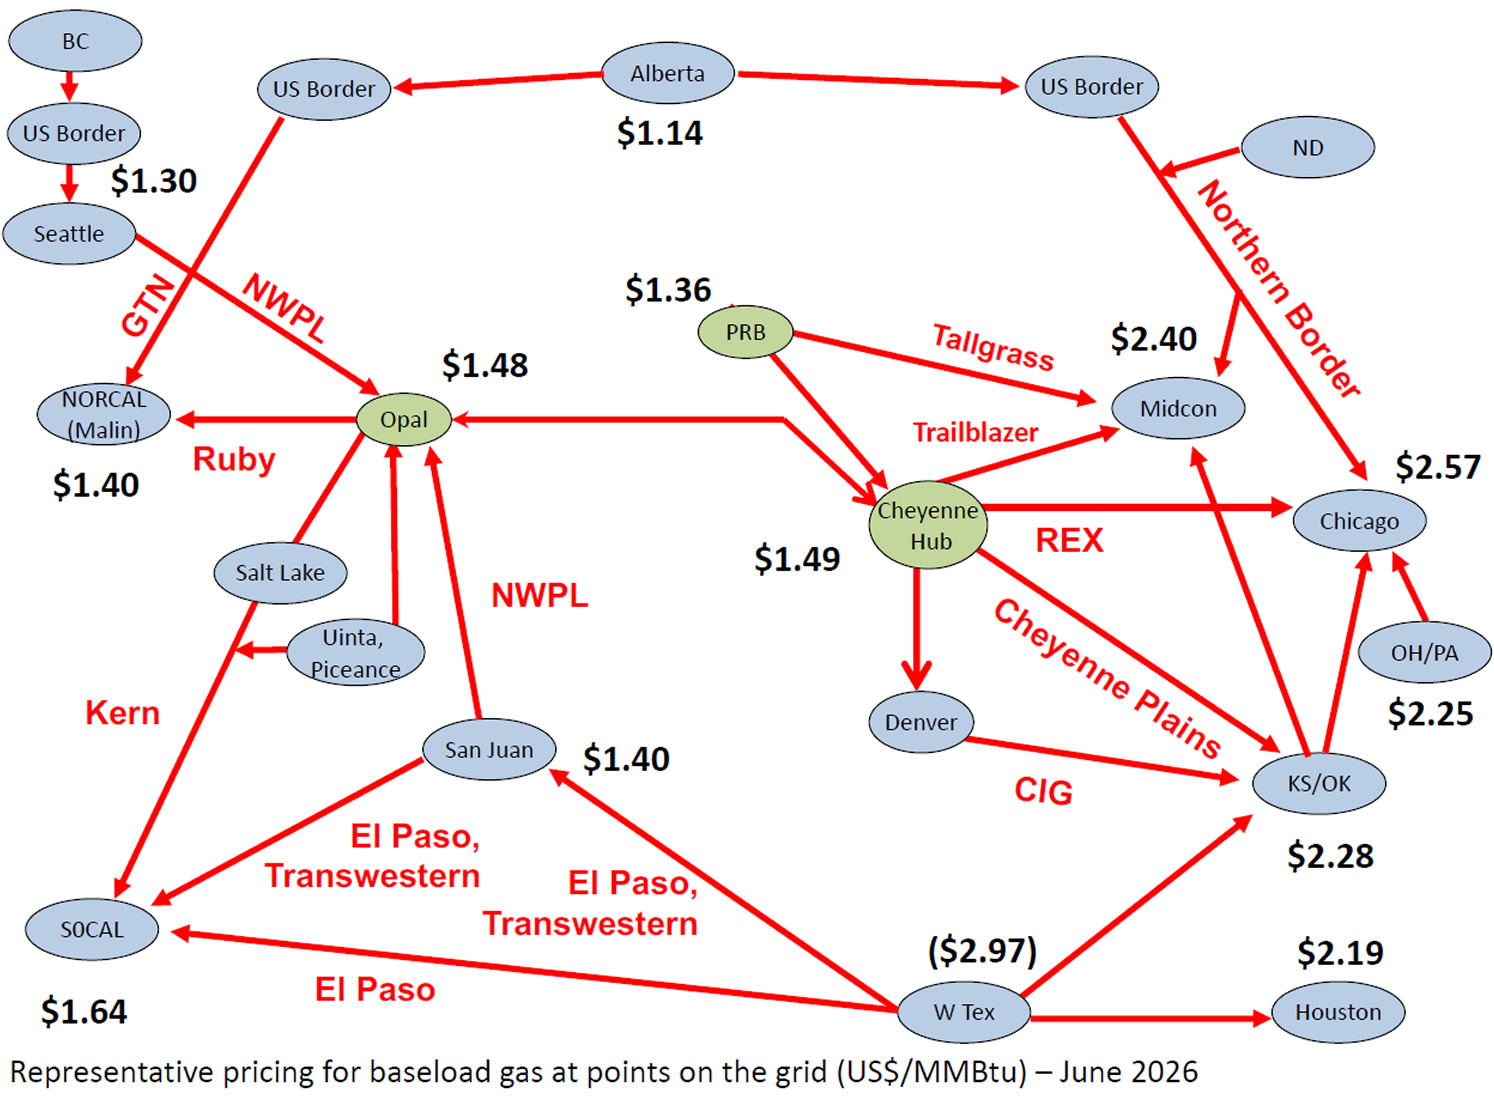
Prices at all points in the Rockies and the Pacific Northwest improved over the course of the month but have only gained from dismal to uninspiring. The most attractive outlet from the Rockies remained to the Midwest from the Cheyenne Hub.
Two versions of the two charts this month. Each pair includes a version with the Permian price and a version without. This allows a little more detail in the versions without the Permian prices.